
Statistics
Aurora SendCloud statistics cover sending and tracking data across different filter conditions and dimensions.
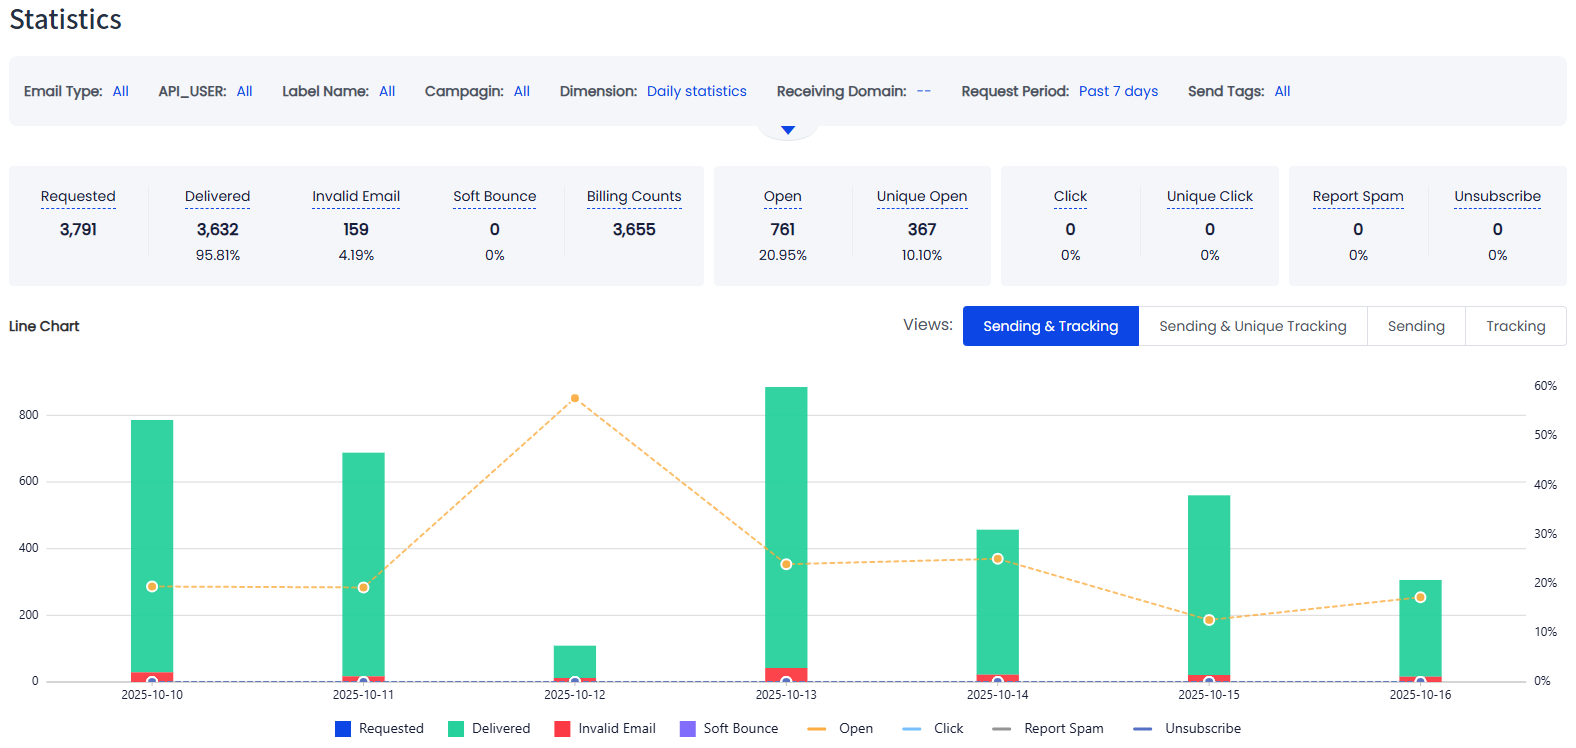
Aurora SendCloud Email Statistics
Email Statistics Dashboard
Aurora SendCloud provides comprehensive email statistics to help you track your email campaign performance. Monitor delivery rates, engagement metrics, and recipient behavior across different dimensions and time periods.
Understanding Your Email Metrics
Track your email performance with these key metrics:
| Metric | Description |
|---|---|
| Requested | Total number of email send requests submitted to Aurora SendCloud |
| Delivered | Number of emails successfully delivered to recipient's mailbox provider. Rate = Delivered ÷ Requested |
| Invalid Email | Number of emails that cannot be delivered permanently. Issues include invalid addresses, hard bounces, or suppression list blocks. Rate = Invalid Email ÷ Requested |
| Soft Bounce | Number of emails that cannot be delivered temporarily. Issues include a full mailbox, temporary recipient server issues, or spam filtering. Rate = Soft Bounce ÷ Requested |
| Billing Count | Number of emails that count toward your account usage and billing |
| Open | Total email opens, including multiple opens by the same recipient Rate = Open ÷ Delivered |
| Unique Open | Number of individual recipients who opened the email at least once Rate = Unique Open ÷ Delivered |
| Click | Total link clicks, including multiple clicks by the same recipient Rate = Click ÷ Delivered |
| Unique Click | Number of individual recipients who clicked at least one link Rate = Unique Click ÷ Delivered |
| Spam Report | Number of emails marked as spam by recipients Rate = Spam Report ÷ Delivered |
| Unsubscribe | Number of recipients who clicked unsubscribe links Rate = Unsubscribe ÷ Delivered |
Open, click, and unsubscribe statistics are counted only after you enable tracking.
Tracking Statistics Example
Example CalculationScenario: You send emails to recipients X and Y. Both emails are successfully delivered.
Activity:
- Recipient X: Opens the email twice, clicks link M twice, and clicks link N once
- Recipient Y: Opens the email three times, clicks link M once, and clicks link N twice
Results:
- Open: 2 + 3 = 5 total opens
- Unique Open: 1 + 1 = 2 unique recipients
- Click: 2 + 1 + 1 + 2 = 6 total clicks
- Unique Click: 1 + 1 + 1 + 1 = 4 unique recipients
Filtering Options
Analyze your email performance using these filtering dimensions:
| Dimension | Description |
|---|---|
| Email Type | Filter by Trigger emails (transactional) or Batch emails (marketing) |
| API_USER | View statistics for a specific API_USER |
| Label | Filter by the custom Label assigned to your email sends |
| Campaign | Analyze the performance of specific email Campaigns |
| Receiving Domain | Break down results by recipient email provider domain (gmail.com, yahoo.com, etc.) |
| Request Period | Select the timeframe for your analysis (default: last 7 days) |
| Send Tags | Filter by custom tags included in your API requests |
| Template ID | View statistics for a specific template |
Grouping Options
Organize your email statistics by selecting one of these grouping methods:
- Group by Day (default) - Daily performance breakdown
- Group by Week - Weekly performance trends
- Group by Month - Monthly performance overview
- Group by Receiving Domain - Performance by email provider
- Group by Template ID - Performance by email template
Choose the grouping that best matches your reporting needs and analysis goals.
Updated 5 days ago